Network Alignment Score
Overview
The Network Alignment Score is given on an index level and is designed to show how well aligned a customer is to the network for a given control index. The score is given out of 750 rounded to the nearest whole number. The score may also be shown in relation to the mean score for an index across all contributing customers, and in relation to the upper and lower quartiles or confidence interval around the mean. A score is provided for each index to which a customer is a contributor but the mean, and other statistical data, is only shown where there are at least three contributors to the index.
The score measures both alignment of control coverage and alignment of control metadata by assigning points per network control weighted by the type and completeness of match to a customer control
Purpose
To create a unified and individual customer index score as a unit of comparability; measuring the alignment of a customer’s controls – and design of those controls – to the network. The creation of the score and calculation of the mean and quartiles allows for comparison in control design alignment to the network between indices and in relation to others within the peer group.
When considered as a delta from the mean and quartile ranges the score can be used to allow comparison across a customer’s indices. This also allows a customer to understand where they sit in relation to others in their peer group for each index.
The score relative to the mean and interquartile range gives an indication of “technical” inherent risk. The score allows a customer to understand their control coverage for those which the network have identified. The score over time can show how a customer has reacted to the network through changes to their control environment.
Calculation – Explanation
The Network Alignment Score is based on the results of control matching. Points are scored based on the number of customer controls within each group of matches where a maximum score of 1 can be achieved for any single Network control. This stops the possibility of a customer with multiple controls partially matched to one Network control scoring more highly than a customer with a single direct match.
The score per customer control in each matching group is shown in the image:
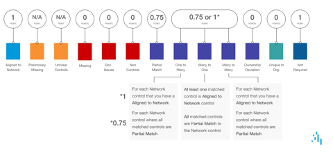
With the sum of:
- Aligned to Network
- One to Many, Many to One, Many to Many (with a maximum of 1 for each Network Control)
- Not Required
- Partial Match
The total is then divided by the maximum possible score; equal to the number of Network controls in the index (this provides the “Index Multiplier”). The Multiplier index will change as the consensus of the network adds or removes controls from the index.
This is then multiplied by 750 and rounded to the nearest whole number to create the Network Alignment Score for a specific customer for a specific index.
The mean is the total sum of all of the scores for all customers contributing to an index divided by the number of customers. The upper quartile is the median value in the upper half of this data set, the lower quartile is the median value in the lower half of the data set.
Calculation – Worked Example
For Customer A in index γ
| Matching Group | Count of Customer Controls per Group | Points Scored |
|---|---|---|
| Aligned to Network | 5 | 5 |
| Partial Match | 21 | 15.75 |
| One to Many | 2 different Customers Controls, each matched to 3 different sets of network controls: For customer control 1: Direct match to two Network controls and a partial match to a third Network Control. For customer control 2: Partial match to 3 different Network controls | For Customer control 1= 1 For Customer Control 2= 0.75 |
| Many to One | 4 different Network Controls matched to 2 different customer controls: For customer control 3: Direct matched to 1network control and a partial match to another network control. For Customer control 4: Partial Match to two different network controls | For Customer control 1= 1.75 For Customer control 2= 1.5 |
| Many to Many | 3 network controls matched to 2 customer controls with overlap. Network control 1 has a direct match .Network control 2 has both a partial and direct match to two different customer controls. Network Control 3 has a partial match to a customer control | For Network control 1= 1 For Network control 2= 1 (the greater of 0.75 and 1) For Network control 3= 0.75 |
| Not Required | 2 | 2 |
| Action | Result |
|---|---|
| Number of Network controls in index γ | 73 |
| Sum of Points for Customer A | 30.5 |
| Index Multiplier | = 30.5 / 73 = 0.418 |
| Index Base | 750 |
| Score Calculation | = 0.418 x 750 = 313.5 |
| Final Score | 314 |
Practical Use of Score
Different levels of score lead to different possible interpretations of insight. Many insights that come from the Network Alignment Score should viewed in relation to the delta from the mean and with consideration of the Strength of Consensus Score for each index.
The Network Alignment Score provides the most transparent way for a customer to compare their position within the Network, as well as across each of their indices, is through the delta form the mean. A low absolute score is not necessarily an issue unless it is significantly lower than the index average. This is more significant if the strength of consensus for that index is high. When the Strength of Consensus score is taken into account it can help to prioritise areas of focus for a customer.
The score can be used to inform the judgements being made on control coverage and control design as part of the assessment of control effectiveness within risk management.
Measuring the score over time can show whether a customer has made changes to their control landscape to bring them more in line with the network. It can also show where the changes to the network have not been adopted by a customer. A customer can improve their scores by introducing new controls, amending existing controls, or simplifying their control landscape, creating more alignment with the network.
The Status Report for each index allows customers to understand what changes can be made to improve their score.